ROS与Matlab语言入门教程-专业ROS消息的使用
一些常见的ROS消息存储的格式,后期在使用之前需要进行转换。MATLAB能够帮助你转换常见的ROS消息格式,有利于简化应用。在本例,你可以探索激光扫描仪的消息类型,有关解压和压缩图片以及点云方面的处理工作。 预备知识:基本ROS消息的使用。
载入消息实例
首先,载入本例将使用的消息样例,这些消息来自多种机器人传感器。调用“exampleHelperROSLoadMessages”载入消息: exampleHelperROSLoadMessages
激光扫描仪消息
在机器人学领域,激光扫描仪是常见的传感器,通过创建合适类型的空消息,你可以看到ROS中激光扫描仪的标准消息格式。 使用“rosmessage”创建消息: emptyscan = rosmessage(rostype.sensor_msgs_LaserScan) emptyscan =
ROS LaserScan message with properties:
 MessageType: 'sensor_msgs/LaserScan'
    Header: [1x1 Header]
  AngleMin: 0
  AngleMax: 0
AngleIncrement: 0
 TimeIncrement: 0
  ScanTime: 0
  RangeMin: 0
  RangeMax: 0
    Ranges: [0x1 single]
Intensities: [0x1 single]
由于你创建的是空消息,因此“emptyscan”没有包含任何有意义的数据。方便起见,“exampleHelperROSLoadMessages”函数载入了激光扫描仪的消息,该消息已经填充好数据并存储在“scan”变量中。检测“scan”变量,消息中最主要的数据时“Ranges”字段,“Ranges”中的数据时一个640*1的以很小的角度增量存储障碍距离阵列。 scan scan =
ROS LaserScan message with properties:
MessageType: 'sensor_msgs/LaserScan'
    Header: [1x1 Header]
  AngleMin: -0.5467
  AngleMax: 0.5467
AngleIncrement: 0.0017
 TimeIncrement: 0
  ScanTime: 0.0330
  RangeMin: 0.4500
  RangeMax: 10
    Ranges: [640x1 single]
   Intensities: [0x1 single]
使用“readCartesian”函数,使用者可以获得笛卡尔坐标系下的测量点。 xy = readCartesian(scan) xy =
0.7886   -0.3803
0.7887   -0.3786
0.7907   -0.3780
0.7908   -0.3763
0.7909   -0.3747
0.7929   -0.3740
0.7924   -0.3721
0.7924   -0.3705
0.7945   -0.3698
0.7945   -0.3682
0.7966   -0.3675
0.7966   -0.3659
0.7967   -0.3642
0.7977   -0.3631
0.7978   -0.3615
0.7978   -0.3598
0.7979   -0.3582
0.7999   -0.3575
0.7974   -0.3547
0.7975   -0.3531
0.7995   -0.3524
0.7995   -0.3508
0.8036   -0.3509
0.8016   -0.3484
0.8017   -0.3468
0.5188   -0.2234
0.5168   -0.2215
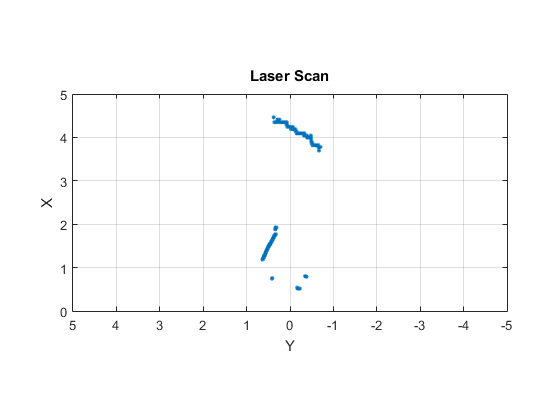
... 该函数返回一系列在有效测量范围计算的[x,y]坐标。 用户可以使用“plot”函数可视化扫描消息。 plot(scan,'MaximumRange',5)
图像消息
MATLAB为图像消息提供了支持,消息格式总是“sensor_msgs/Image”。 使用“rosmessage”指令创建一个空消息,查看标准的ROS图像消息格式。 emptyimg = rosmessage(rostype.sensor_msgs_Image) emptyimg =
ROS Image message with properties:
MessageType: 'sensor_msgs/Image'
 Header: [1x1 Header]
 Height: 0
  Width: 0
   Encoding: ''
IsBigendian: 0
   Step: 0
   Data: [0x1 uint8]
简化起见,“exampleHelperROSLoadMessages”函数载入了图像消息,该消息已经填有数据并存储在“img”变量中。 检查工作空间中的消息变量“img”,图片的尺寸信息存储在“Width”和“Height”属性中,ROS使用一维阵列传输真正的图像数据,存放在“Data”字段。 img img = ROS Image message with properties:
MessageType: 'sensor_msgs/Image'
 Header: [1x1 Header]
 Height: 480
  Width: 640
   Encoding: 'rgb8'
IsBigendian: 0
   Step: 1920
   Data: [921600x1 uint8]
“Data”字段存储的是原始的图像数据,在MATLAB中并不能用于直接处理或可视化,用户可以使用“readImage”函数恢复出与MATLAB兼容的图像格式。 imageFormatted = readImage(img); 原始的图像的编码格式为“rgb8”,默认情况下,“readImage”函数返回一个标准的4806403的uint8的格式,用户可以使用“imshow”函数查看图像。 imshow(imageFormatted)

图6.2 MATLAB支持所有的ROS图像编码格式,“readImage”函数处理转换图像的复杂工作,除了彩色图像,MATLAB还支持单色图像和深度图像。
压缩的消息
许多ROS系统以压缩的格式传输图像数据,MATLAB提供对这些压缩图像消息的支持。 使用“rosmessage”创建一个空的压缩图像消息,在ROS中的压缩图像的消息类型是“sensor_msgs/CompressedImage”,拥有标准的格式。 emptyimgcomp = rosmessage(rostype.sensor_msgs_CompressedImage) emptyimgcomp =
ROS CompressedImage message with properties:
MessageType: 'sensor_msgs/CompressedImage'
 Header: [1x1 Header]
 Format: 'bgr8; jpeg compressed bgr8'
   Data: [30376x1 uint8]
与图像消息类似,用户可以使用“readImage”函数标准的RGB格式的图像,即使压缩图像的原始编码格式是bgr8,“readImage”也会做相应的转换。 compressedFormatted = readImage(imgcomp); 用户可用使用“imshow”函数可视化图像。 imshow(compressedFormatted)
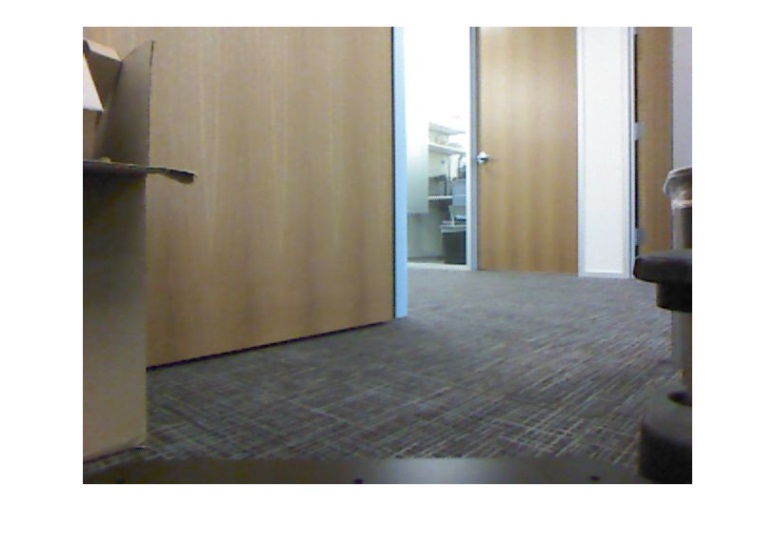
图6.3 大部分的图像格式都支持压缩图像类型,“16UC1”和“32FC1”编码不支持压缩深度图像,单色和彩色图像编码支持压缩图像类型。
点云
点云可用由机器人领域的多种传感器采集,如LIDARS、Kinect和立体摄像机。ROS中最常用的传输点云的消息类型是“sensor_msgs/PointCloud2”,MATLAB提供了一些专业的函数供用户使用点云数据。 用户可以通过创建合适类型的空消息查看ROS的标准点云格式: emptyptcloud = rosmessage(rostype.sensor_msgs_PointCloud2) emptyptcloud =
ROS PointCloud2 message with properties:
PreserveStructureOnRead: 0
        MessageType: 'sensor_msgs/PointCloud2'
             Header: [1x1 Header]
             Height: 0
              Width: 0
        IsBigendian: 0
          PointStep: 0
            RowStep: 0
            IsDense: 0
             Fields: [0x1 PointField]
               Data: [0x1 uint8]
查看工作空间中的已经填充数据的点云消息,该消息存储在“ptcloud”变量中: ptcloud ptcloud =
ROS PointCloud2 message with properties:
PreserveStructureOnRead: 0
        MessageType: 'sensor_msgs/PointCloud2'
             Header: [1x1 Header]
             Height: 480
              Width: 640
        IsBigendian: 0
          PointStep: 32
            RowStep: 20480
            IsDense: 0
             Fields: [4x1 PointField]
               Data: [9830400x1 uint8]
点云信息编码在消息的“Data”字段,用户可以通过调用“readXYZ”函数提取[x,y,z]坐标,存储在为N*3的矩阵。 xyz = readXYZ(ptcloud) xyz =
   NaN       NaN       NaN
   NaN       NaN       NaN
   NaN       NaN       NaN
   NaN       NaN       NaN
   NaN       NaN       NaN
   NaN       NaN       NaN
   NaN       NaN       NaN
   NaN       NaN       NaN
   NaN       NaN       NaN
   NaN       NaN       NaN
   NaN       NaN       NaN
   NaN       NaN       NaN
   NaN       NaN       NaN
   NaN       NaN       NaN
   NaN       NaN       NaN
   NaN       NaN       NaN
   NaN       NaN       NaN
   NaN       NaN       NaN
   NaN       NaN       NaN
   NaN       NaN       NaN
   NaN       NaN       NaN
   NaN       NaN       NaN
   NaN       NaN       NaN
   NaN       NaN       NaN
   NaN       NaN       NaN
   NaN       NaN       NaN
   NaN       NaN       NaN
... 点云数据中的NaN表明一些[x,y,z]的值无效。这是Kinect传感器的一种伪像,用户可以安全的移除所有的NaN值: xyzvalid = xyz(~isnan(xyz(:,1)),:) xyzvalid =
0.1378   -0.6705    1.6260
0.1409   -0.6705    1.6260
0.1433   -0.6672    1.6180
0.1464   -0.6672    1.6180
0.1502   -0.6705    1.6260
0.1526   -0.6672    1.6180
0.1556   -0.6672    1.6180
0.1587   -0.6672    1.6180
0.1618   -0.6672    1.6180
0.1649   -0.6672    1.6180
0.1680   -0.6672    1.6180
0.1710   -0.6672    1.6180
0.1741   -0.6672    1.6180
0.1764   -0.6643    1.6110
0.1803   -0.6672    1.6180
0.1834   -0.6672    1.6180
0.1865   -0.6672    1.6180
0.1895   -0.6672    1.6180
0.1918   -0.6643    1.6110
0.1957   -0.6672    1.6180
0.1979   -0.6643    1.6110
0.2010   -0.6643    1.6110
0.2049   -0.6672    1.6180
0.2080   -0.6672    1.6180
0.2111   -0.6672    1.6180
0.2142   -0.6672    1.6180
0.2163   -0.6643    1.6110
... 一些点云传感器还给点云中的每个点赋RGB彩色的值,如果这些彩色值存在,用户可以调用“readRGB”恢复彩色数据: rgb = readRGB(ptcloud) rgb =
0.8392    0.7059    0.5255
0.8392    0.7059    0.5255
0.8392    0.7137    0.5333
0.8392    0.7216    0.5451
0.8431    0.7137    0.5529
0.8431    0.7098    0.5569
0.8471    0.7137    0.5569
0.8549    0.7098    0.5569
0.8588    0.7137    0.5529
0.8627    0.7137    0.5490
0.8627    0.7216    0.5412
0.8627    0.7333    0.5373
0.8549    0.7294    0.5333
0.8471    0.7216    0.5294
0.8706    0.7373    0.5216
0.8941    0.7412    0.5333
0.8863    0.7255    0.5451
0.8824    0.7176    0.5529
0.8824    0.7216    0.5569
0.8784    0.7333    0.5686
0.8784    0.7255    0.5765
0.8784    0.7176    0.5765
0.8784    0.7412    0.5725
0.8784    0.7569    0.5647
0.8784    0.7451    0.5569
0.8824    0.7373    0.5608
0.8863    0.7490    0.5608
... 在“scatter3”函数的帮助下,用户可以对点云进行可视化,“scatter3”函数将会自动的提取[x,y,z]坐标值,RGB数据如果存在的话,就会以3D散点图的形式显示。“scatter3”函数忽略所有的值为NaN的[x,y,z]坐标,即使该点的RGB值存在。 scatter3(ptcloud)

获取最新文章: 扫一扫右上角的二维码加入“创客智造”公众号


